
Page History
Introduction
The methods featured in this section help architects analyze their enterprises, facilitate shared understanding in their organizations, and lead conversations about prioritization and change. Each method is a lens focused on a few selected themes, usually resulting in a visual summary that aids communication and supports decision making.
Architectural methods focus on themes that may not be well represented in methods for project management, business analysis, or technical analysis. These themes include:
- Taking a high level view of a whole portfolio, business domain, or enterprise
- Tracking change over time in the value, cost, and relevance of solutions or services
- Assessing the architectural value of technology solutions
- Assessing the business value of solutions or services
Methods in Context
These methods stem from different sources and many have overlapping goals. To guide you through these methods in context, ITANA members have contributed the following overviews:
- (TBD)
Methods Overview
 Architecture Hats Architecture Hats | (add description) | ||
 | (add description) | ||
 | (add description) | ||
 | (add description) | ||
 | (add description) | ||
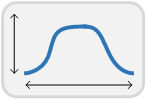
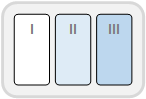
The “hat” visually expresses both the architectural approval (whether it is recommended) and the lifecycle of a thing in a given environment. The life-cycle is indicated by the position of the icon on a curve shaped like a “hat” with a plateau in the middle. Things typically enter the environment and travel up the left slope of the hat and exit the environment on the right slope of the hat. The thing that is described with a “hat” may be a technology, service, or other. | |||
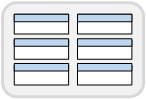
| A brick diagram organizes technology services and components, so an organization can describe and enforce standards, services, and capabilities for a given technology domain. The diagram also describes the lifecycle of technology components - each component will be in one or more of the following: tactical, strategic, retirement, containment, baseline, or emerging. A brick can comprise one or more solutions/implementations in which an enterprise invests to support its capabilities. | ||
| A business capability, or simply a “capability,” defines what a business does. It does not communicate or expose where, why, or how something is done — only what is done. Specifically, the business capability is “a particular ability or capacity that a business may possessor exchange to achieve a specific purpose or outcome (Cutter)." Business capability modeling captures the core functional model for an organization without the bias imposed by the organization's structure itself. | ||
| Synthesizes lessons learned, scope, business capabilities, roadmap. Something to do that sums up an engagement. “Here’s what was gleaned; these are the next steps.” An opportunity to synthesize the various aspects of engagement with the stakeholder. Brings together the various perspectives into a coherent narrative that contextualizes next steps. | ||
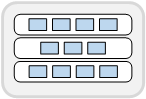
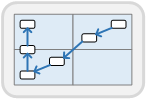
| The Core Diagram is a hybrid tool that brings together value chains, capabilities and conceptual data objects in one view. It represents the information technology constructs that enable interaction between a service provider and a service consumer. The consumers' functional tasks are chained together on a timeline across the top horizontal, the providers functional tasks are chained together on a timeline across the bottom horizontal, and the technology solutions are organized in the center by logical groupings. | ||
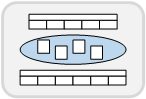
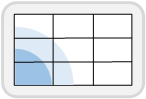
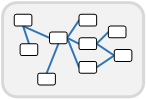
 | This is a dependency graph that overlays some kind of optimization diagram. It can easily be created on the fly to clarify the relationships among various initiatives. The top two quadrants contain business items of business value. The two right quadrants contain personal or local items of value. The top right contains the primary target. The lower left are necessary underpinnings that are not obvious per se as business goods. | | (add description) |
 | (add description)An Investment Value Matrix (aka Engagement Value Matrix) facilitates discussion of solutions or initiatives in terms of business value and architectural value. It can be used to guide or make a case for prioritization of investment, or to evaluate existing solutions. | ||
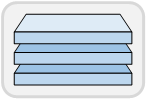 | (add description) "Pace-Layered Application Strategy is a methodology for categorizing, selecting, managing and governing applications to support business change, differentiation and innovation, [based on the rate of change of the application]" (Gartner). Pace-layering differentiates the rate of change into three categories - Systems of Record (slow change), Systems of Differentiation (medium change), and Systems of Innovation (high change). | ||
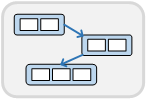 | (add description) Process maps provide a shared high level understanding of end-to-end business processes in a business domain. The method focuses on what activities take place, rather than how, and helps identify all kinds of opportunities for improvement (not limited to technology changes). | ||
 | A Roadmap shows a path from current state to a desired future state. The roadmap method builds consensus on vision, goals, milestones, and deliverables. The roadmap can be used to rally a community around a plan for action as well as manage expectations for outcomes over time. | | (add description) |
 | Semantic Data Models(add description) A semantic data model describes the concepts that are important to an organization along with their meanings and relationships to other important concepts. It is something like an authoritative Glossary of Terms along with diagrams or other ways of showing the relationships between different data. A semantic model has an emphasis on relationships and meaning and how the data relate to the real world. | ||
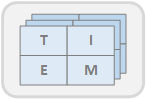 | TIME Models(add description) A portfolio investment decision making tool used with stakeholders with regard to a constantly changing time dimension. Used to create alignment of IT investments with institutional strategy. Provides transparency into the decision making process. The core TIME diagram shows three dimensions: business value, technical quality/condition, and time. |
| Panel | ||
|---|---|---|
| ||
|
| Panel | ||
|---|---|---|
| ||
The pages in this section were drafted by the participants in the Spring 2015 ITANA Face2Face workshop. Many thanks to the the participants and to everyone who contributed methods for consideration! |
Overview
Content Tools