
Introduction
Description: This is a dependency graph that overlays some kind of optimization diagram. It can easily be created on the fly to clarify the relationships among various initiatives.
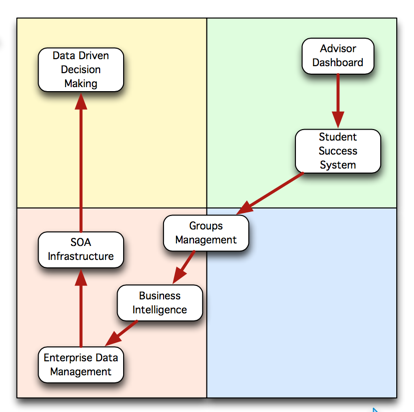
The top two quadrants contain business items of business value. The two right quadrants contain personal or local items of value. The top right contains the primary target. The lower left are necessary underpinnings that are not obvious per se as business goods.
In the illustration the downward pointing arrow indicates dependency. The upward pointing arrow indicates enablement.
Goals: One or more targets can be related to each other and be enabled by the same technological underpinnings.
Dependency Graphs are useful to show the particular dependencies and required infrastructure necessary to implement a productive and efficient new tool to the business. It communicates the complexity of implementing and supporting a specific requested technology by visualizing the multiple dependencies required to get to the desired outcome.
Dependency Graphs help tell the story that to get the things stakeholders want in the high value quadrant, you depend on all the other related things not in that quadrant.
Context:
When trying to understand links between ideas or cause–and–effect relationships, such as when trying to identify an area of greatest impact for improvement.
When a complex issue is being analyzed for causes.
When a complex solution is being implemented.
After generating an affinity diagram, cause–and–effect diagram or tree diagram, to more completely explore the relations of ideas.
Source: http://asq.org/learn-about-quality/new-management-planning-tools/overview/relations-diagram.html
Scope: This tool is more effective in high level planning and portfolio management. When trying to have discussions with stakeholders and reality checks on projects. This tool is more useful when trying to engage with non-subject matter experts, that don’t necessarily understand the support value between the different components.
Scenarios
Trends in the market indicate a new tool that is highly useful and productive for the business need.
Business owner requests a new initiative and is willing to support the cost of the new technology
IT Architect identifies all architecture components that are required to support the new tool by mapping out and identifying them in relationship to the requested tool.
Architectural components are identified as dependencies required to support the new tool.
- The architectural components can also be show that they may support a multitude of new tools
A case can be made to invest in the architectural components in order to support the new tool as well as other tools
The architectural components should be viewed as high value to the business because they are required to support the emerging tool that supports higher productivity.
A business case is made to look at the larger context of investing in the architecture components that support the new tool.
Method
Roles:
Service Owners
Subject matter experts that know the dependencies of a given component
Enterprise Architect - help define where in the axis components fit in
Steps:
Identify / brainstorm components. Include the dependencies that need to change (that are impacted) in order to support the thing that stakeholders desire.
Measure component’s organization efficiency and organizational productivity. This may happen as an exercise among stakeholders and be approximate. It is likely that the dependencies such as infrastructure will rank lower on the axis.
- Identify relationship between components
Artifacts: This can best be used as a “one and done” artifact that is created on a whiteboard on the fly so stakeholders can follow the arrows / relationships most effectively.
Tools: The diagram itself is a visualization and can be used as the communication tool.
Communication
It’s never a standalone tool. It is used as a support visualization to help drive the discussion regarding funding and timelines.
- This tool is useful when trying to identify and show the total cost of ownership to the organization.
Examples
Maybe not explicitly but a dot diagram exercise was kind of used at the Univ. of Washington in order to support the implementation of an Enterprise Integration Platform (EIP) for the new ERP HR/Payroll system. If a dot diagram exercise had been done before moving forward with implementing the new HR/P system it would have been recognized that an EIP was a dependency in order to support the usefulness of HR/P data. Additionally, with the dot diagram it would have had a better understanding of the total cost of ownership of a new HR/P system.
Presentation by Jim Phelps:
Related Methods
This tool can be used with TIME Models and the Investment Value Matrix in order to call out the dependency between objects.
This tool is similar to Simon Wardley’s value chain maps. Wardley’s tool also communicates the idea that you are trying to move in a given direction for some certain things in the dependency graph.
Case for Action is important to ensure the desired outcome has value and is actionable.
Architecture Methods > Dot Diagrams
Links
- Jan-Martin Lowendahl, Connect the Dots to Engage Faculty in Higher Education Strategy: The Learning Stack Example (requires Gartner login)
- 2012 presentation (PDF) by Jim Phelps
Contributors
Want to help with this page? Please see the Method Contributor Guide.
Stewards for this page:
José Cedeño, Oregon State University
Robert Dein - Miami University
Scott Fullerton - University of Wisconsin - Madison
Other contributors:
Leo Ferning, University of British Columbia
Chris Eagle, University of Michigan
Rupert Berk, University of Washington
Jason Myers, University of Washington
J.J. Du Chateau - University of Wisconsin - Madison
Jenni Laughlin - University of Washington
Overview
Content Tools