
Introduction
Keywords: Application Portfolio Management (APM), Application Governance, Project Portfolio Management (PPM)
Description: A portfolio investment decision making tool used with stakeholders with regard to a constantly changing time dimension. Used to create alignment of IT investments with institutional strategy. Provides transparency into the decision making process.
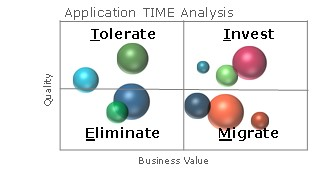
The core TIME diagram shows three dimensions:
Business value: ranking items by based on their increasing/decreasing business value over time
Technical quality/condition: ranking items based on the increasing technical cost or risk of maintaining them over time
Time: looking into the future, where items will move between quadrants over time
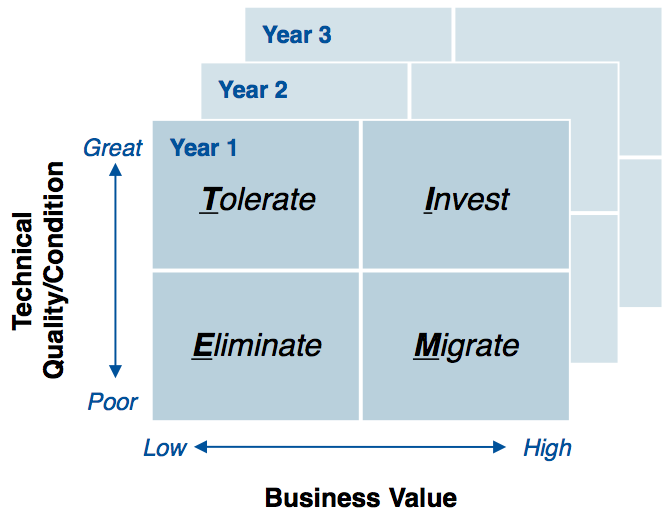
At each point in time, the core diagram divides items into four quadrants for different kinds of action:
Tolerate -
higher bar for enhancements
Monitor for increased risk
Consider providing some functionality elsewhere
Re-evaluate for elimination
Invest
Respond quickly to enhancements
Maintain focus on the best solution
Maximize usage
Migrate
Minimize enhancements
Mitigate risks
Sponsor a replacement or alternative
Prepare users for migration
Eliminate
No enhancements
Mitigate risks
Get buy-in for shutdown
- Work through dependencies
Goals:
Help a group of stakeholders get a shared understanding of business value and technical relevance as criteria
Help a group of stakeholders get a shared understanding of how applications or services change in value over time, and should therefore be managed differently over time
Prioritize applications or services for different kinds of action, such as investment, migration, or elimination
Context: A TIME model is well suited for:
- Application or solution portfolio management; prioritizing investment in applications or solutions
- Project portfolio management; prioritizing projects that will expand, migrate, eliminate, or mitigate risk around applications or solutions
- Service portfolio management; prioritizing services in terms of business and architectural value
Source: Gartner provides materials on this method, such as the article cited on this slide.
Scenarios
TIME is a key method used in Application Portfolio Management (APM). It can help IT have difficult conversations about where investments should be made and where they should not be made.
Audience: IT directors, application owners, business stakeholders
Scope: An application portfolio (institution-wide, or more narrow)
Goals and outcomes: Agree on priorities that will drive next steps (such as investment, elimination, or mitigation)
TIME can also inform the Project Governance process by aligning proposed projects with the direction set by the business and reflected in the completed TIME model (applications mapped to TIME). TIME can be used to help prioritize projects that are needed to invest in (expand or improve), migrate away from, successfully eliminate, or mitigate risk around applications or solutions
Audience: IT directors, project sponsors, business stakeholders
Scope: A project portfolio (typically IT or IT-related projects, institution-wide, or more narrow)
- Goals and outcomes: Prioritize projects based on how they co
Method
Roles:
Enterprise Architect, Business Architect-Understand and visualize the current state of application and service to communicate to stakeholders
Enterprise Architect, Project Manager-Facilitate TIME Models creation with Stakeholders in relation to institution strategy
Project Manager-Implement investment identified projects
Portfolio Manager -
Steps: For reference we include the diagram:
Meet with business stakeholders and describe methodology, its purpose and value
Assign a T-I-M-E to each investment. If possible use a structured method to do this that will drive consistent results across domains.
To “plot” each portfolio item, you need an X coordinate (business value) and a Y coordinate (technical quality). You need a methodology for determining each. Some tools that might be used are:
Brick diagrams: While the objects of TIME and brick analysis are portfolio items, the brick model it focused more on quality than business value. TIME, on the other hand, plots both quality and business value
Investment (FKA engagement) Value Diagrams: Investment Value plots architecture against business value instead of Quality against business value. These two may not complement well.
See the Gartner articles about applying the method in detail.
Terms:
Business Value: The participants in the method will need some shared, neutral understanding of business value. In part this needs to be arrived at through discussion.
- Technical Quality/Condition: The participants in the method will need some shared, neutral understanding of technical quality. Specific examples will be helpful here for non-technical participants.
Artifacts: Here is the core TIME diagram:
Sources: Val Sribar, Gartner Keynote: Navigating the Nexus of Change with Pace Layers (2012); Jim Duggan, Application Portfolio Triage: TIME for APM (2010).
Communication
Why are we as an organization using TIME for portfolio management?
Show the process of how the decision was made?
Identify the inventory of applications / services
Categorize these services into the quadrant based on their business and architectural value
Display the progress of diagram over the time (z-axis)
Allow people to voice their opinions / concerns
Help people separate themselves / personal-value from the services they created / invented / manage
- Tie the outcomes of the TIME diagram over time with the organization’s strategic goals
Examples
(to be completed)
Related Methods
TIME could be used to align investments to capability maps to show where investments will be made for each business capability.
One might use Brick Diagrams to ASSESS technical quality and condition, and use this assessment as the input to determining the x coordinate for the mapping exercise.
Architecture Methods > TIME Models
Links
Contributors
Stewards for this page:
- J.J. Du Chateau, University of Wisconsin - Madison
Jason Myers, University of Washington
Revisit team:
Jose Cedeno, Oregon State University
Piet Niederhausen, University of Washington
David Roberts, University of Michigan Medical School
Dana Miller, Miami University of Ohio
Jenni Laughlin, Univ of Washington
Scott Fullerton, Univ of Wisconsin - Madison
J.J. Du Chateau, Univ of Wisconsin - Madison
Rick Tuthill, Univ of Massachusetts - Amherst
Overview
Content Tools